

Edit | Leave a Comment | Favorite
More Like This: (Beta Temporary Feature)


User Comments:
Anonymous commented at 2010-01-12 01:30:08 » #200148
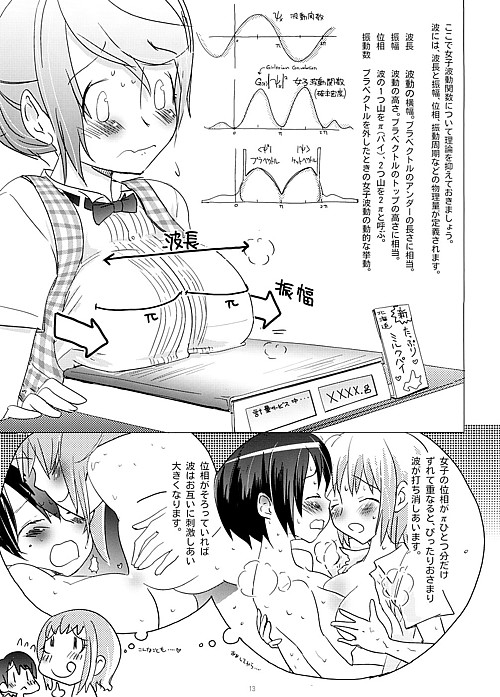
hmmm this is very clever! if the psi represents a wavefunction (as is usual in quantum mechanics), then the graph of a sinusoidal psi results in a quadratic sinusoid with two peaks when the graph of the probability density function is plotted. The third graph shows the eigenstate |psi> and its conjugate <psi|, probably referring to left and right tit. So it's a quantum model of tits, probably? And the two pi's on the diagram could probably refer to the phase angle subtended by each tit, after rectification with the wavenumber.
But I can't read Japanese (much) ): And I agree with anon above, I don't think this can be accurate.
 3 Points
 Flag
Flag
hmmm this is very clever! if the psi represents a wavefunction (as is usual in quantum mechanics), then the graph of a sinusoidal psi results in a quadratic sinusoid with two peaks when the graph of the probability density function is plotted. The third graph shows the eigenstate |psi> and its conjugate <psi|, probably referring to left and right tit. So it's a quantum model of tits, probably? And the two pi's on the diagram could probably refer to the phase angle subtended by each tit, after rectification with the wavenumber.
But I can't read Japanese (much) ): And I agree with anon above, I don't think this can be accurate.
Flag
1